What the Market Really Looks Like for Existing Homes

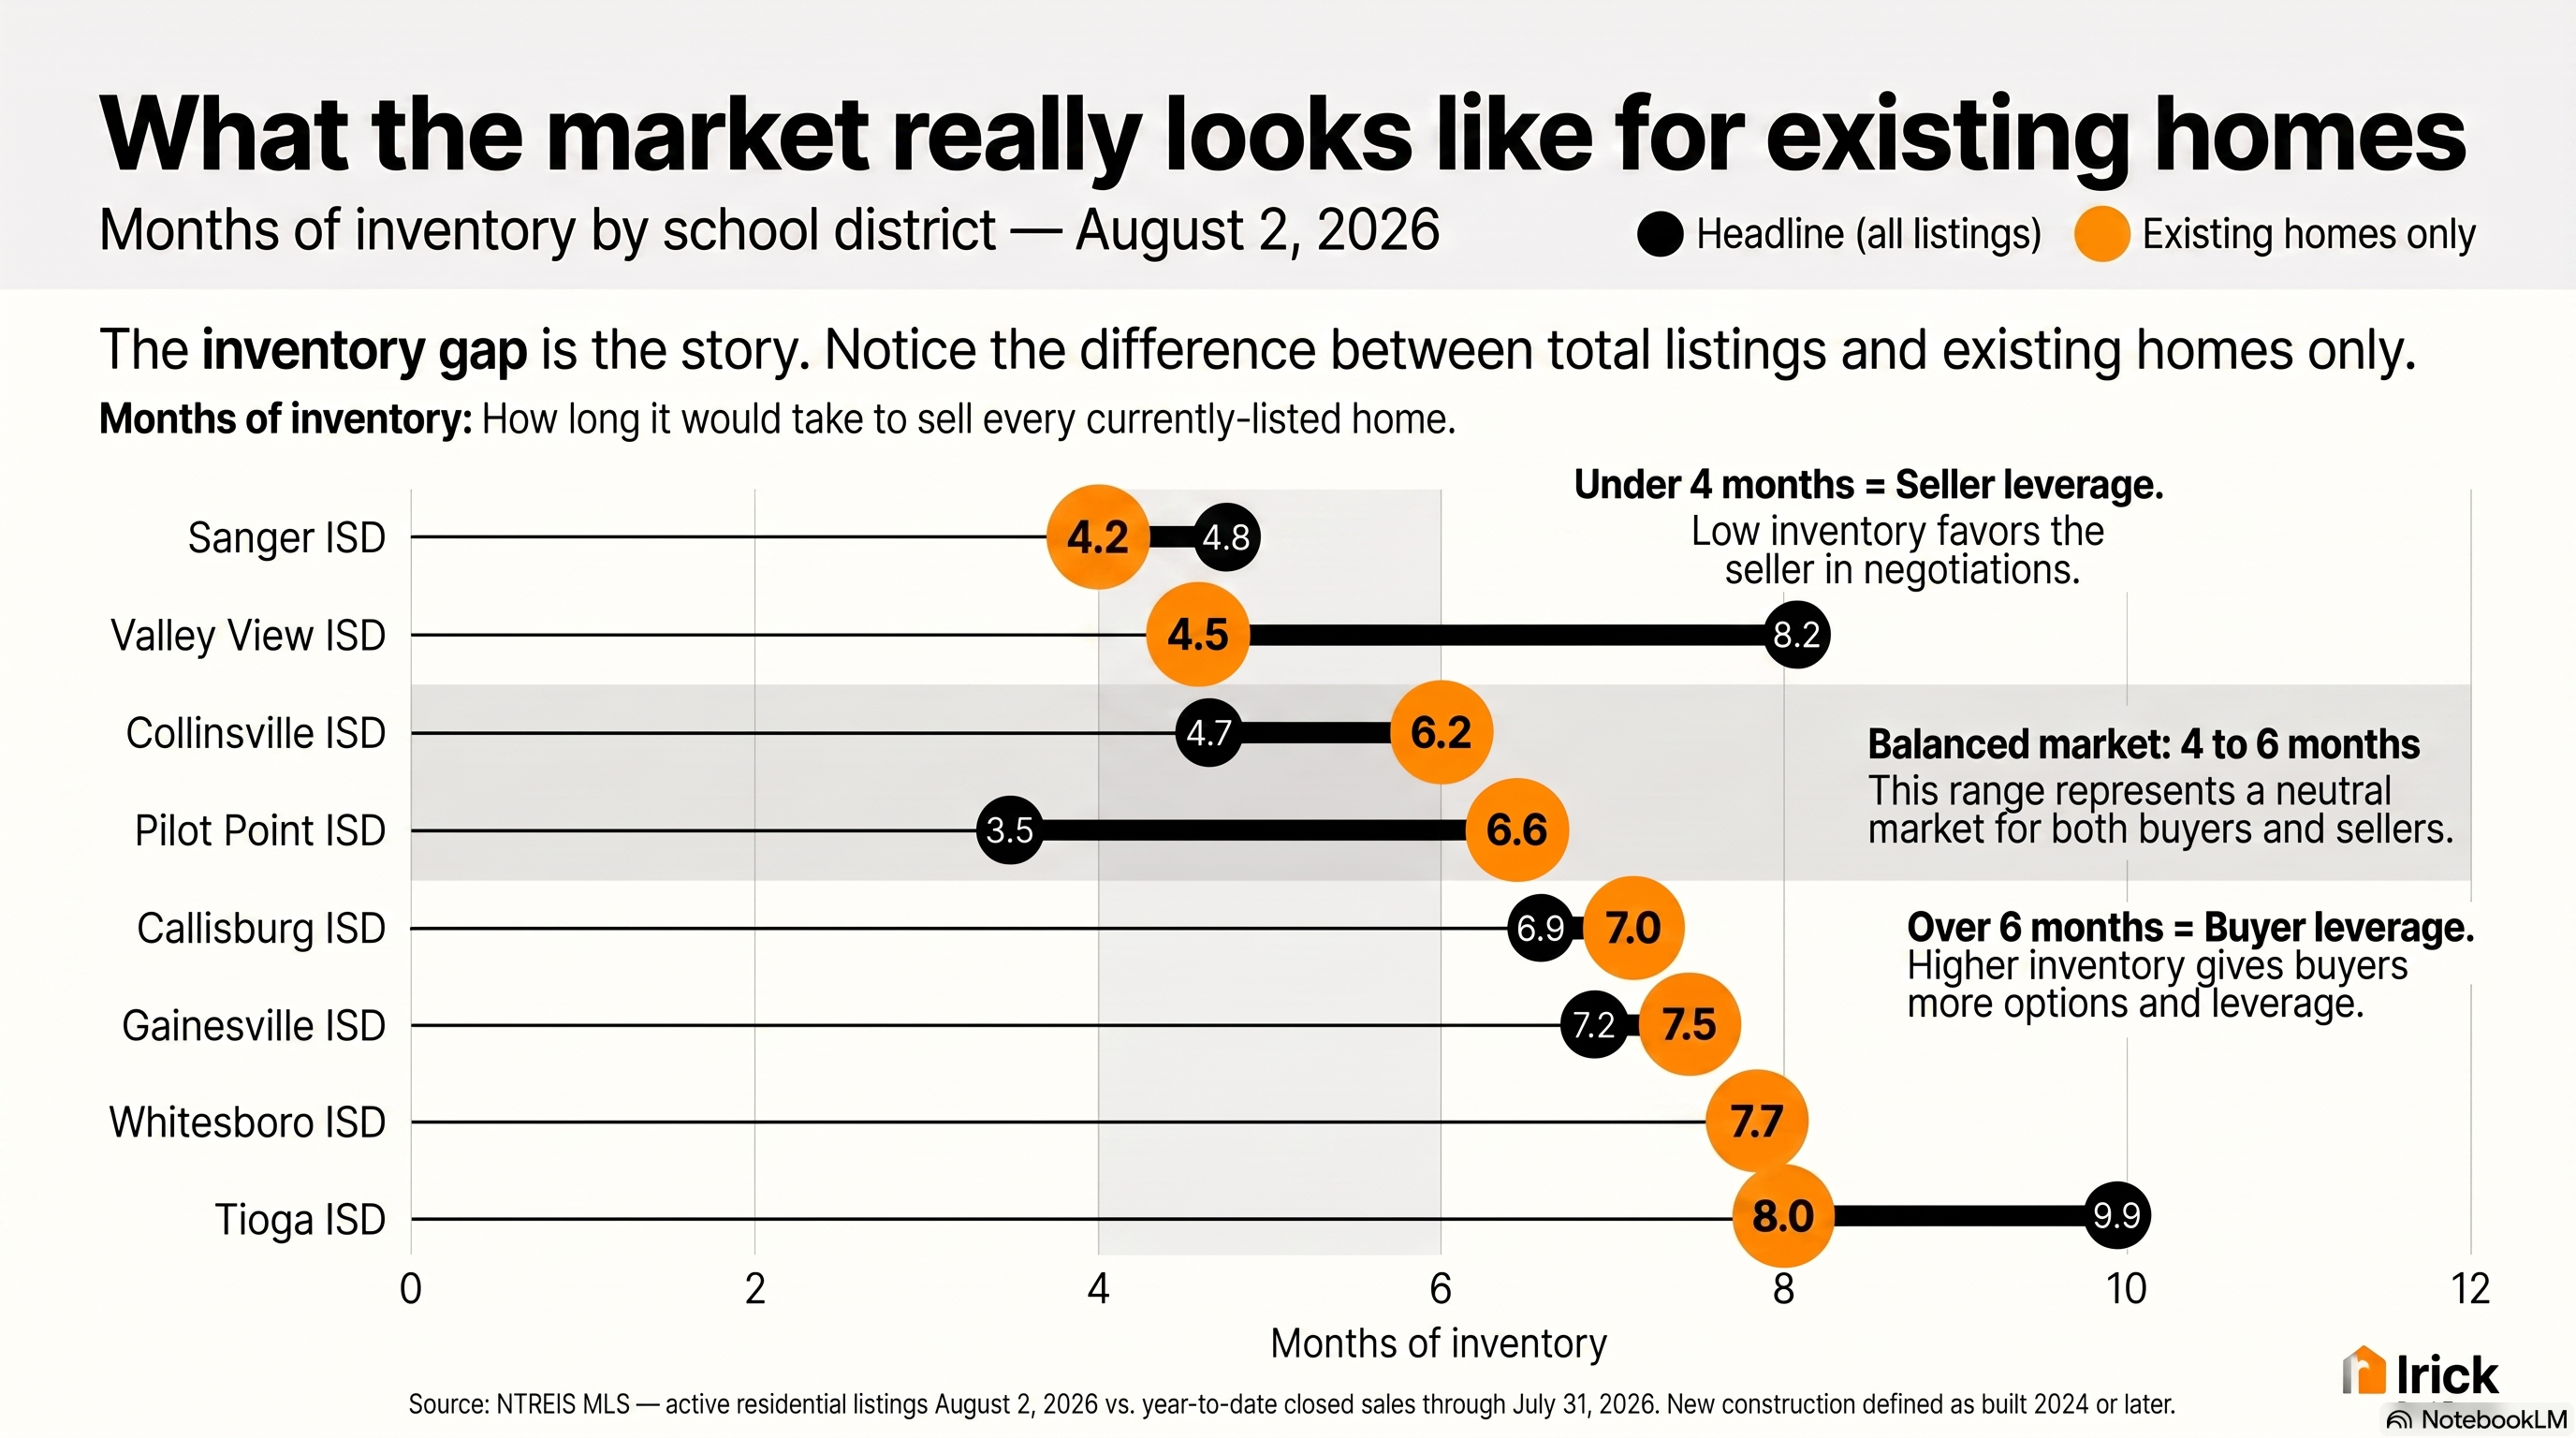
This week's chart is one worth spending a minute on because it's directly relevant if you own an existing home and are thinking about selling.
The standard measure of a real estate market's temperature is months of inventory — take all the homes for sale in your ISD today, divide by how many homes are actually selling each month, and you get the number of months it would take to sell every current listing if no new ones came on the market. Under four months means sellers have leverage. Over six means buyers do. Four to six is what a healthy, balanced market looks like.
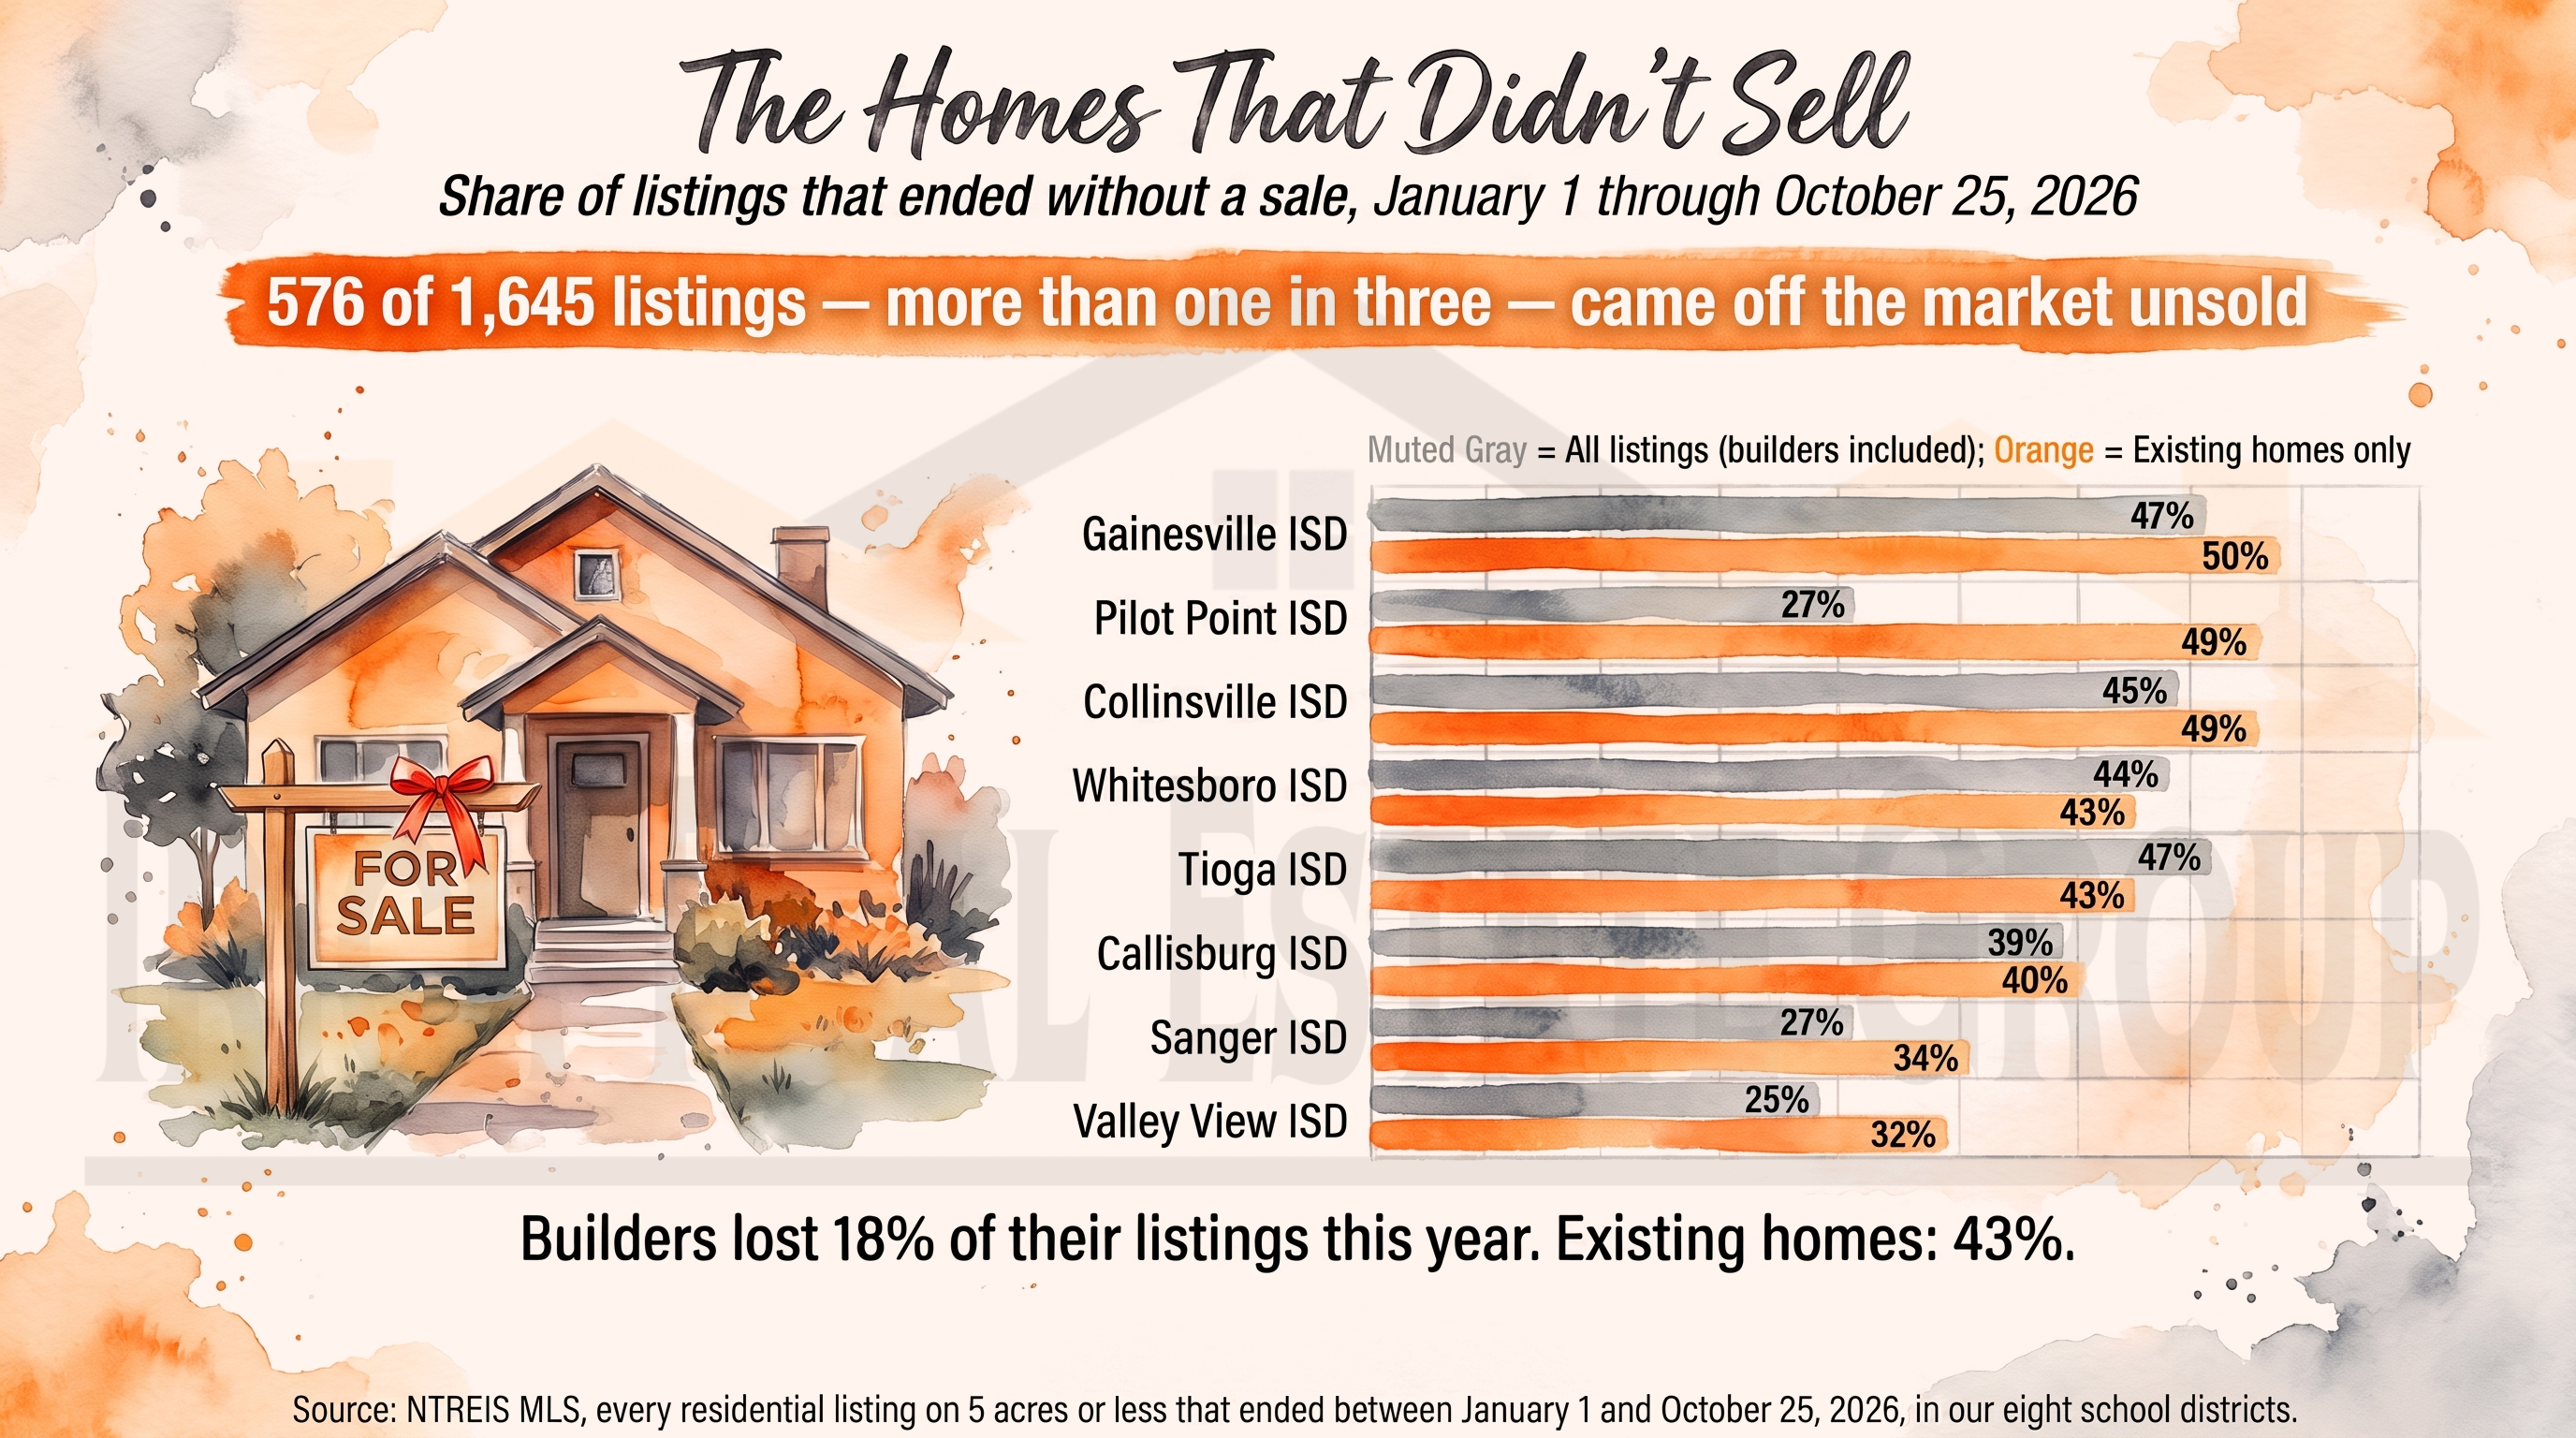
But there's a problem with the headline number, and it's a big one for you. About a third of our current inventory is brand-new construction from the builders. Their homes and yours are not the same market. Their pricing, their absorption, their incentives — all different from what a normal homeowner is dealing with. If you own an existing home and you're using the headline number to understand your market, you're being handed a picture that includes a lot of your NON-competition.
So this week's chart strips the builders out and shows you what's really happening for existing-home sellers in each ISD, side by side with the headline number everyone else is quoting.
Want to know what this means for your home? Call or text Chance Kirby at (940) 300-6900 for a free price opinion based on recent sales near you.