Is Your Home Worth More Than a Year Ago? Price Per Square Foot by District

Is your home worth more than it was a year ago? Here's the honest answer.
Over the last two weeks I graded the summer on price and on speed. This week the summer series gets its final chapter, and it's the question every homeowner actually wants answered. I'm going to give it to you straight, because that's the whole point of this newsletter.
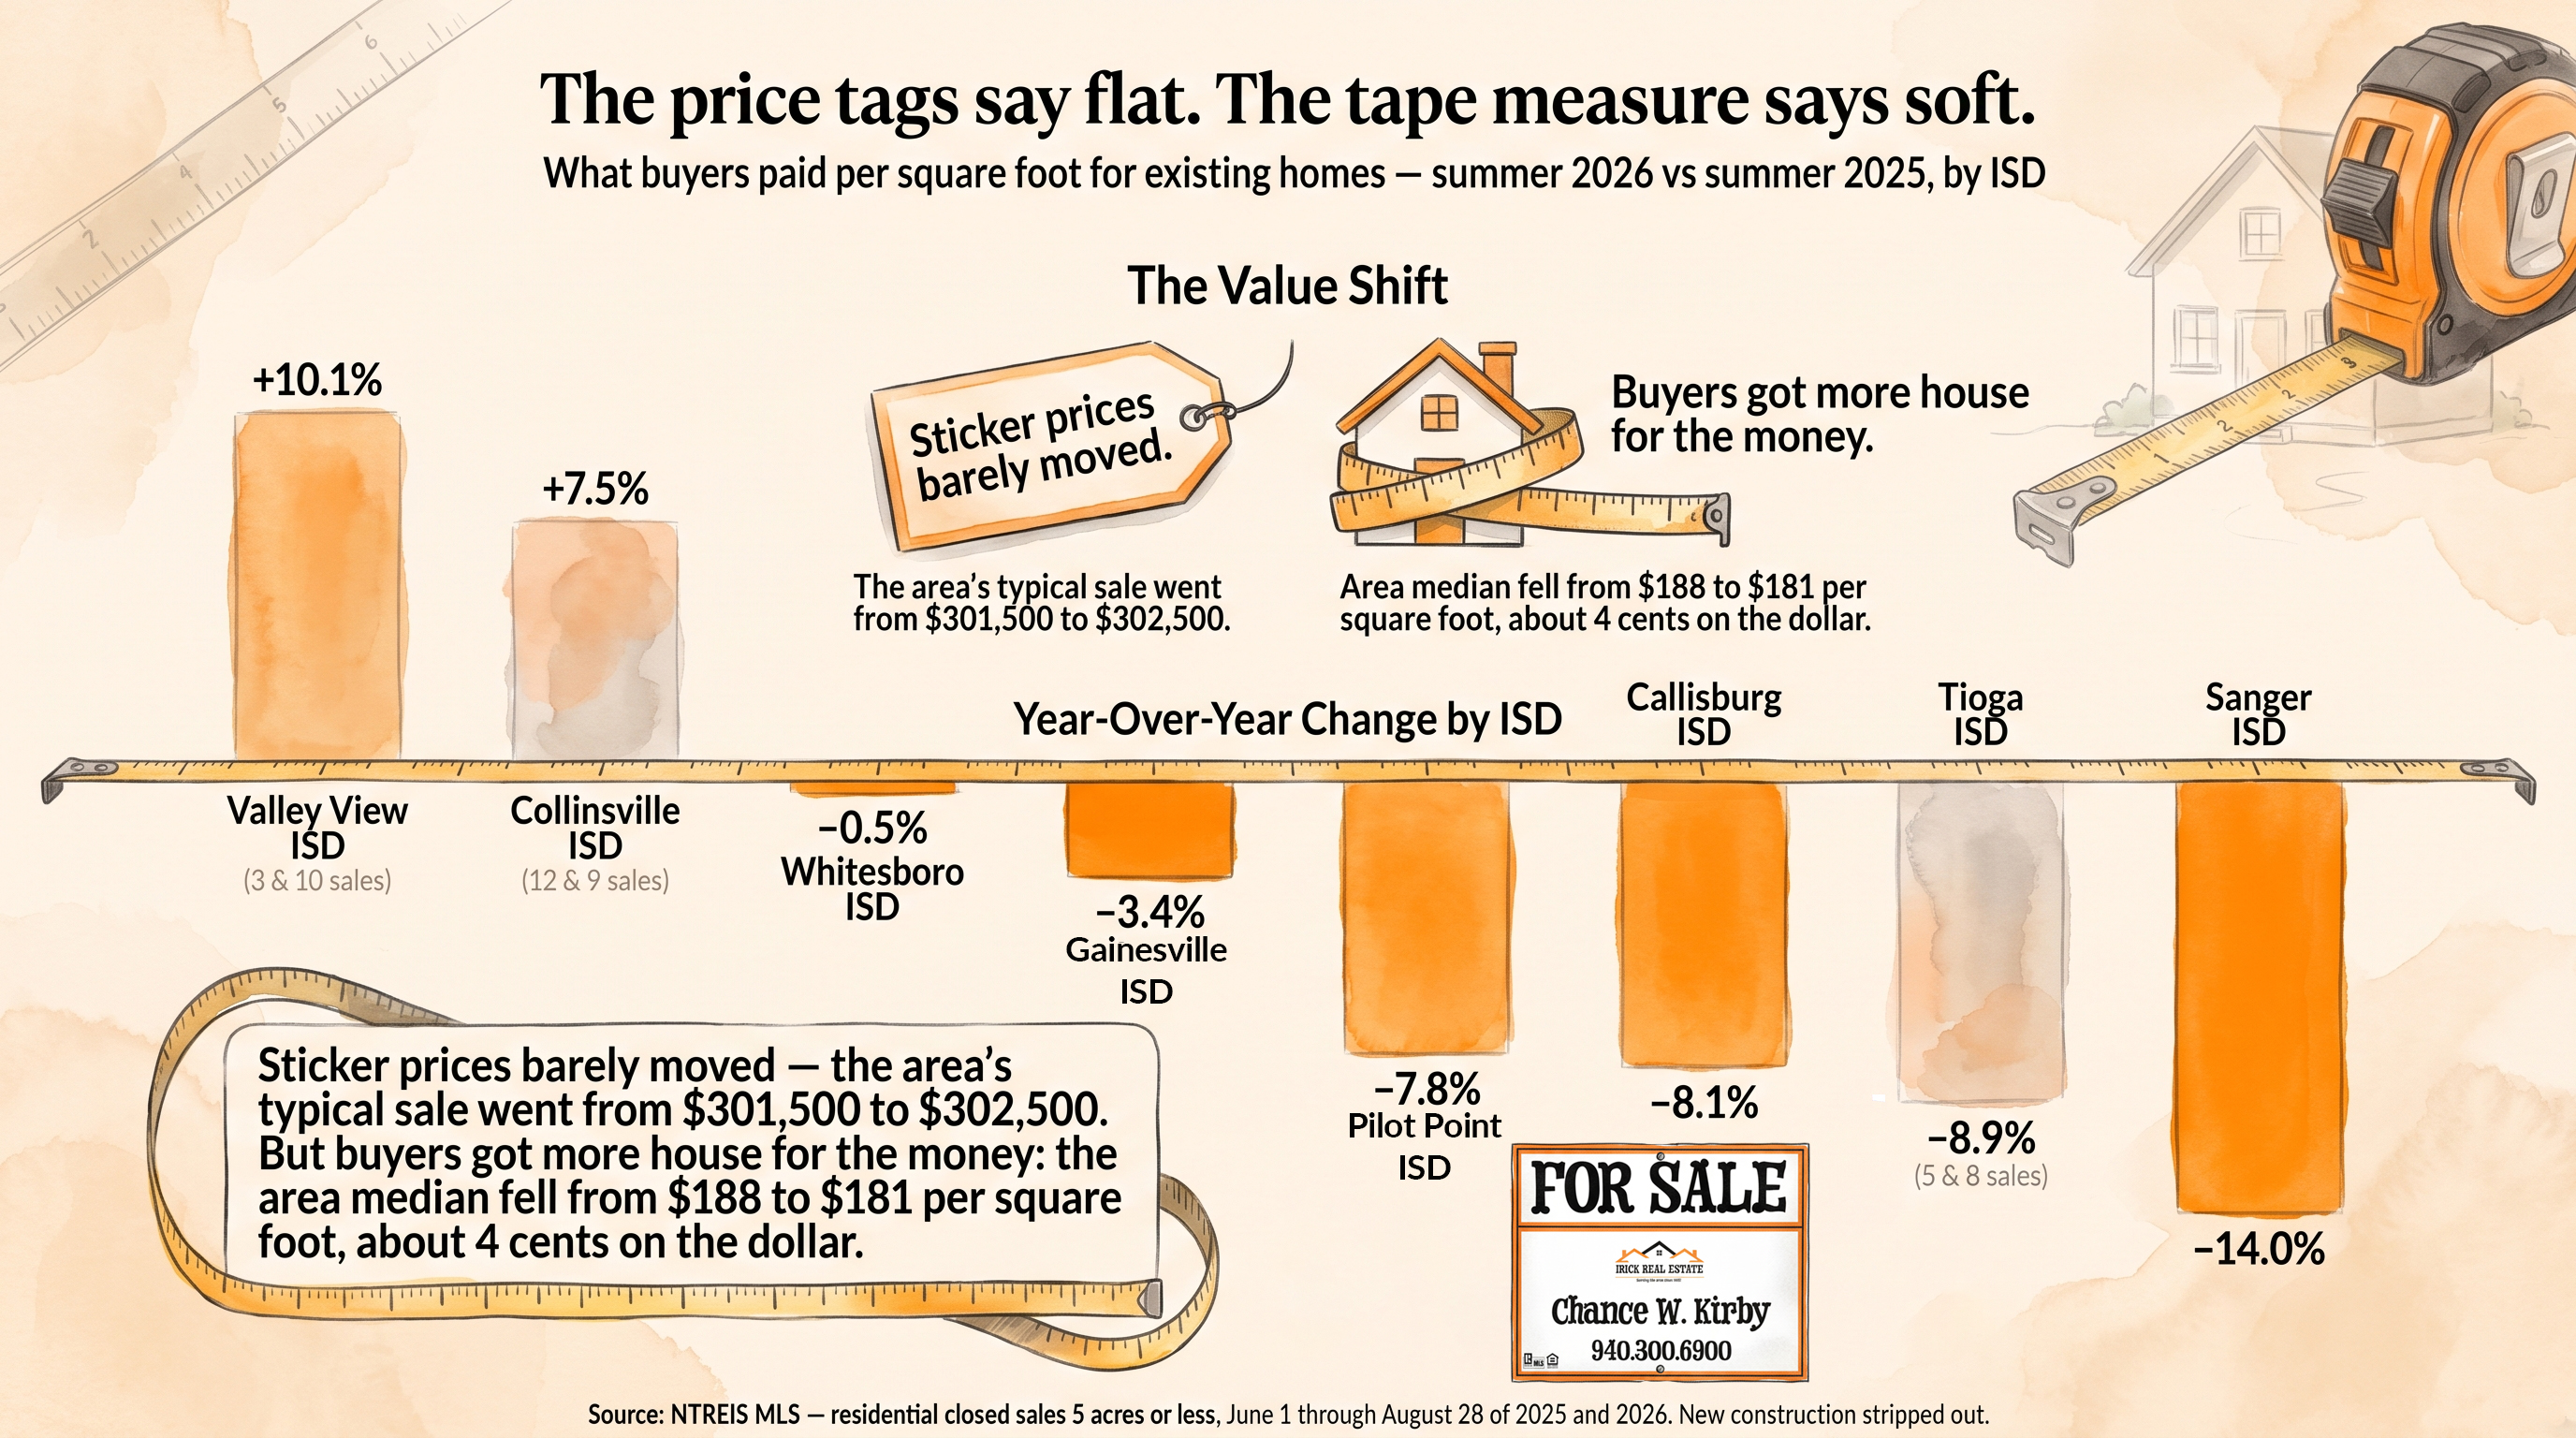
First, how I measured, because this week it matters more than usual. Existing homes only, builders stripped out, same June-through-August window both years. And instead of comparing sale prices, I compared what buyers paid per square foot — the tape measure, not the price tag. Here's why: if this summer's buyers happened to buy bigger houses than last summer's — and they did — the price tags can look perfectly flat even while every individual home quietly gives up a little ground. The tape measure doesn't fall for that.
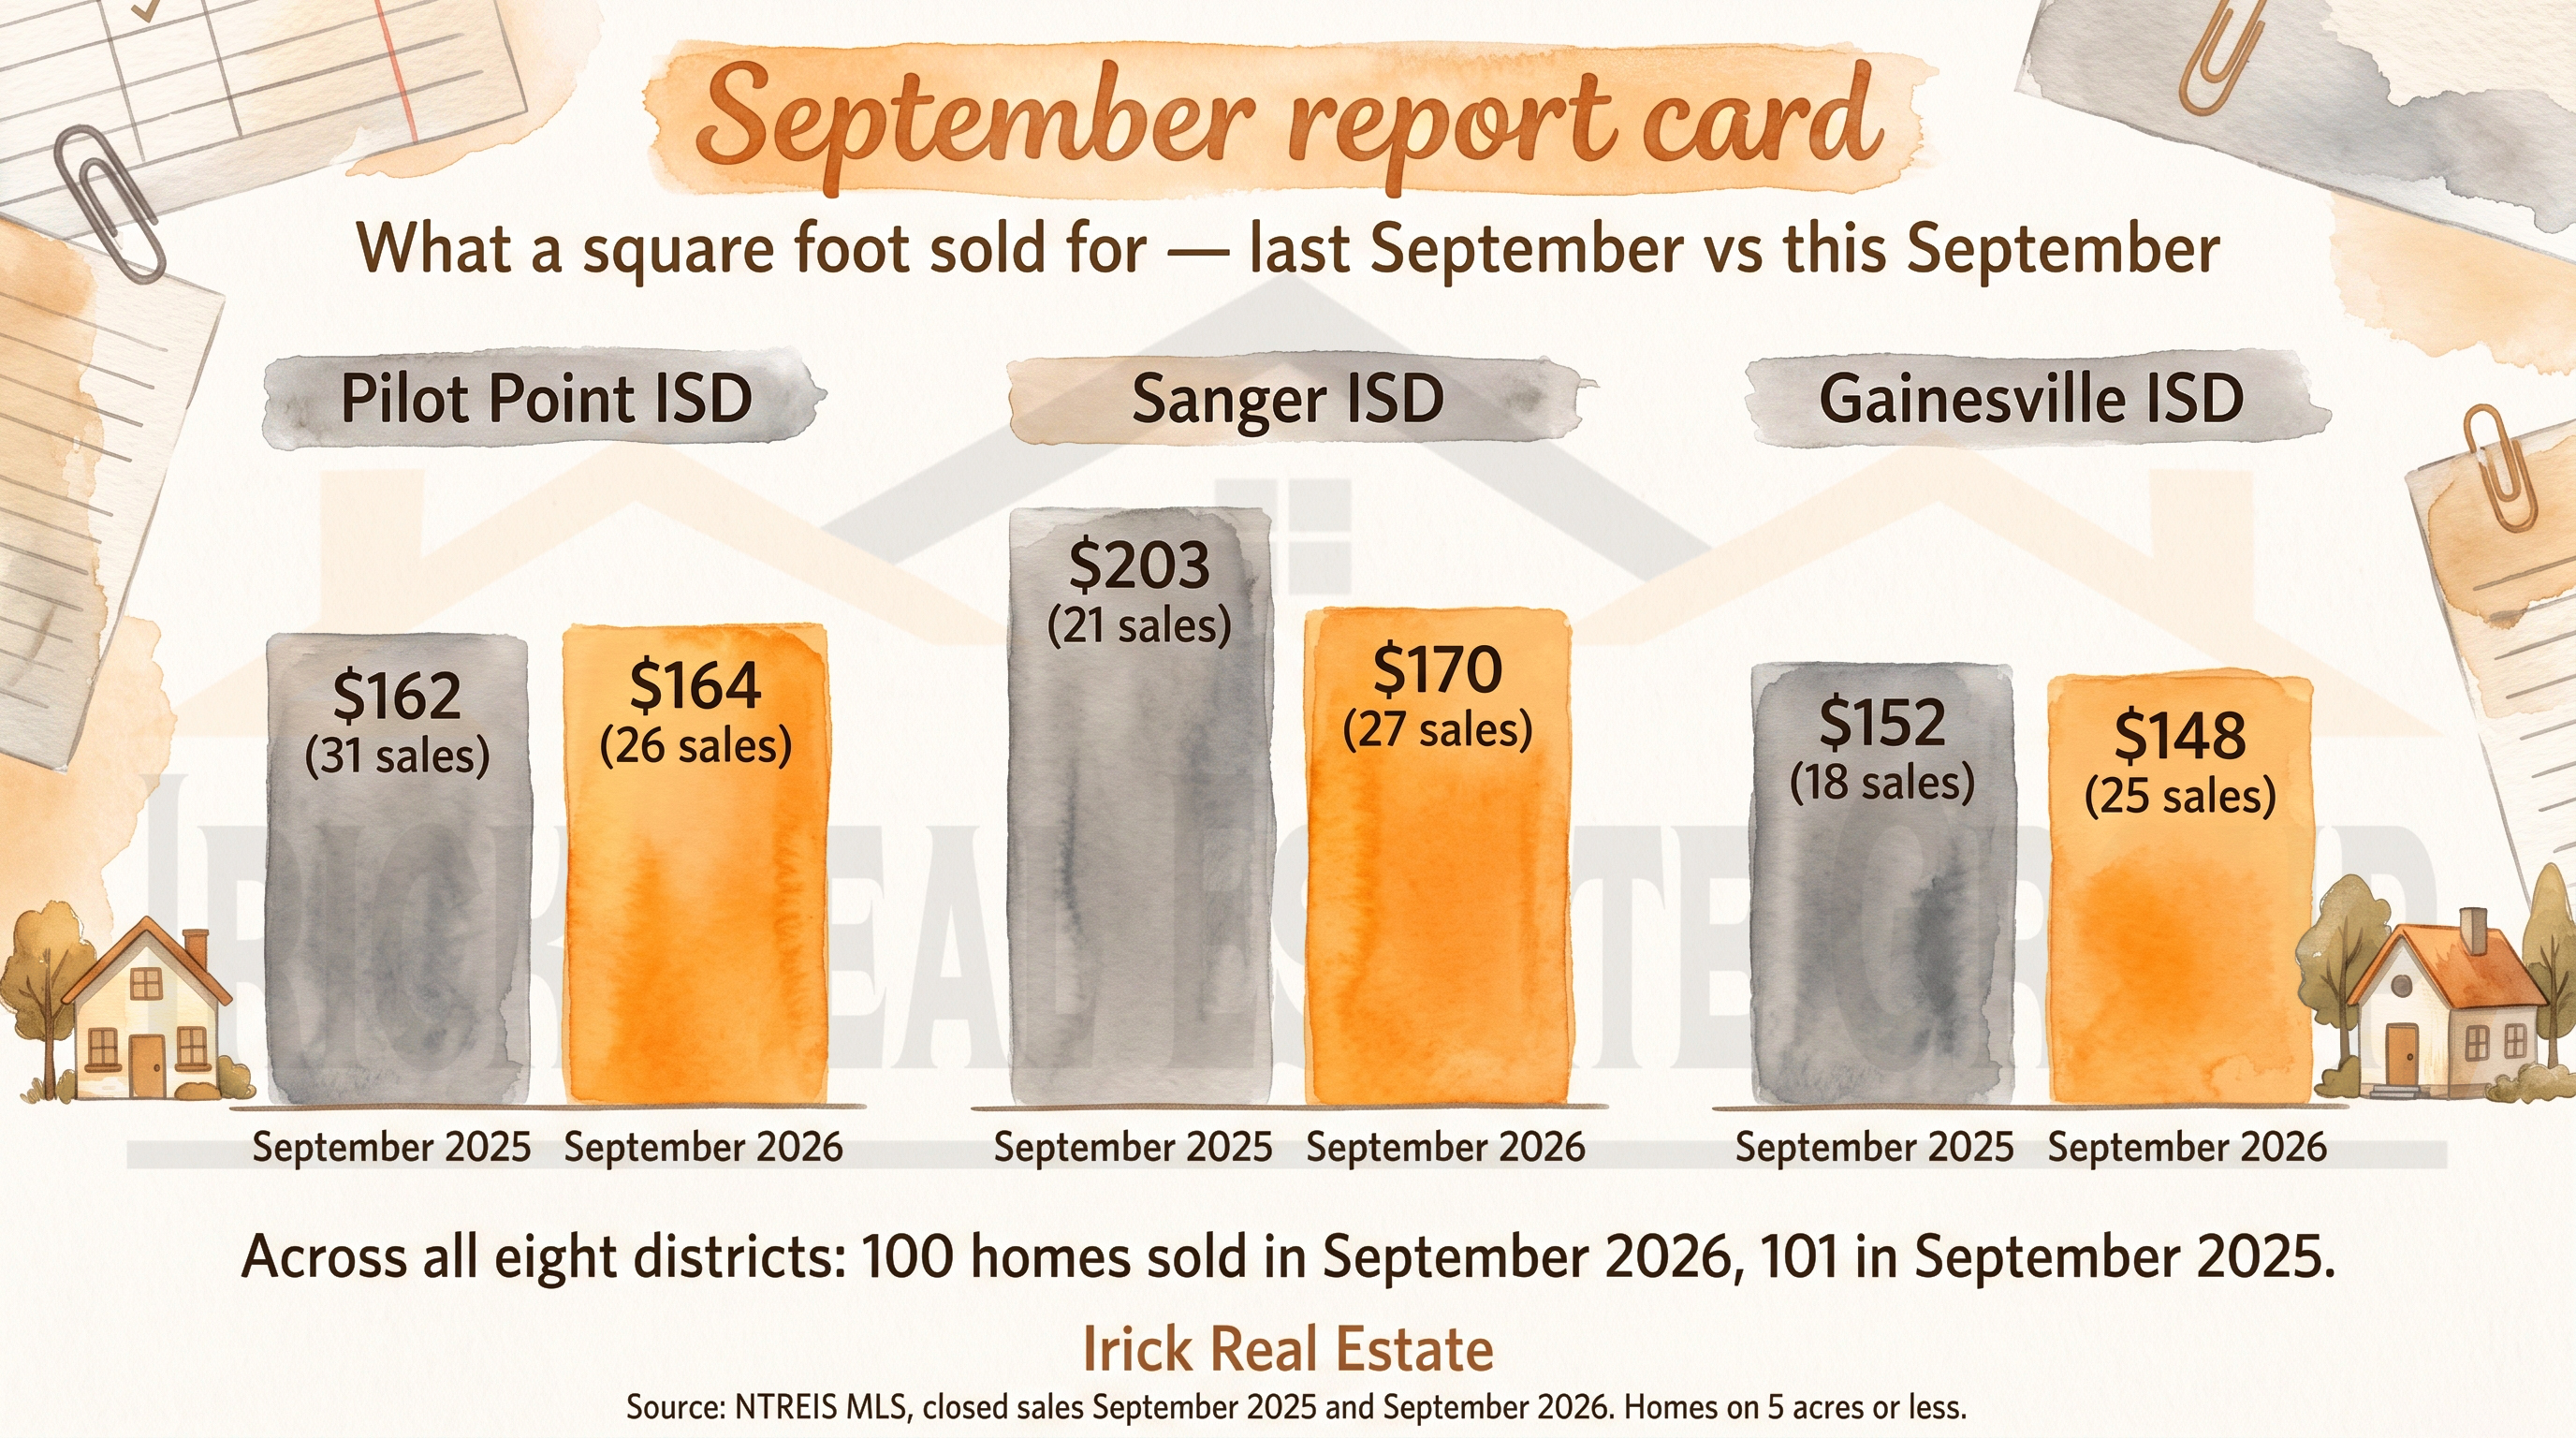
And that's exactly what happened. The price tags say flat: the typical sale in our area was $301,500 last summer and $302,500 this summer — up a hair. The tape measure says soft: buyers paid about $188 per square foot last summer and about $181 this summer. Both numbers are true at the same time. Buyers spent the same money and got more house for it — about 4 cents less on every dollar of value.
District by district, the tape measure says: Whitesboro ISD held essentially flat. Gainesville ISD gave up about 3 cents on the dollar. Pilot Point ISD and Callisburg ISD each gave up about 8. And Sanger ISD had the hardest summer on the chart, down about 14 cents on the dollar — and that's not one strange sale skewing things; I checked, and the softness runs through Sanger's whole price range. The usual honesty note: Valley View ISD, Collinsville ISD, and Tioga ISD only had a handful of sales one year or the other, so they're printed faint on the chart with their sale counts — the two that show gains are hints, not verdicts.
Let me put the tape measure in dollars, back-of-the-envelope — this is arithmetic, not an appraisal. On a 2,000-square-foot home, the area-wide slip is worth about $14,000 over the year. In Pilot Point it's closer to $30,000, and in Sanger the same math says roughly $57,000. Numbers like that are why I refuse to hand you a blended average and call it a market report.
Now, what to actually do with this. If you own and aren't selling, this is a paper move, not a bill — you haven't lost a dime unless you sell. If you're thinking about selling this fall, this changes one conversation: price to this summer's dollar, not last summer's. The fall window I wrote about in August is still real — serious buyers, less competition — but the sellers who win in it will be the ones priced for the market that exists, not the one that existed a year ago. Remember the report card: the districts where sellers kept 95 cents and sold in 30 days were the ones priced right out of the gate. And if you're a buyer who's been waiting — this is the first summer in a while the tape measure moved your way.
Thirty-four years of selling homes here has taught me that markets don't announce their turns; they whisper them in numbers like these. If you want to know what the tape measure says about your street — not the area, not even your district, your street — that's a fifteen-minute conversation, and I'm here to help.
Chance Kirby - Irick Real Estate
940.300.6900
Want to know what this means for your home? Call or text Chance Kirby at (940) 300-6900 for a free price opinion based on recent sales near you.