September Report Card: Price Per Square Foot, This Year vs. Last


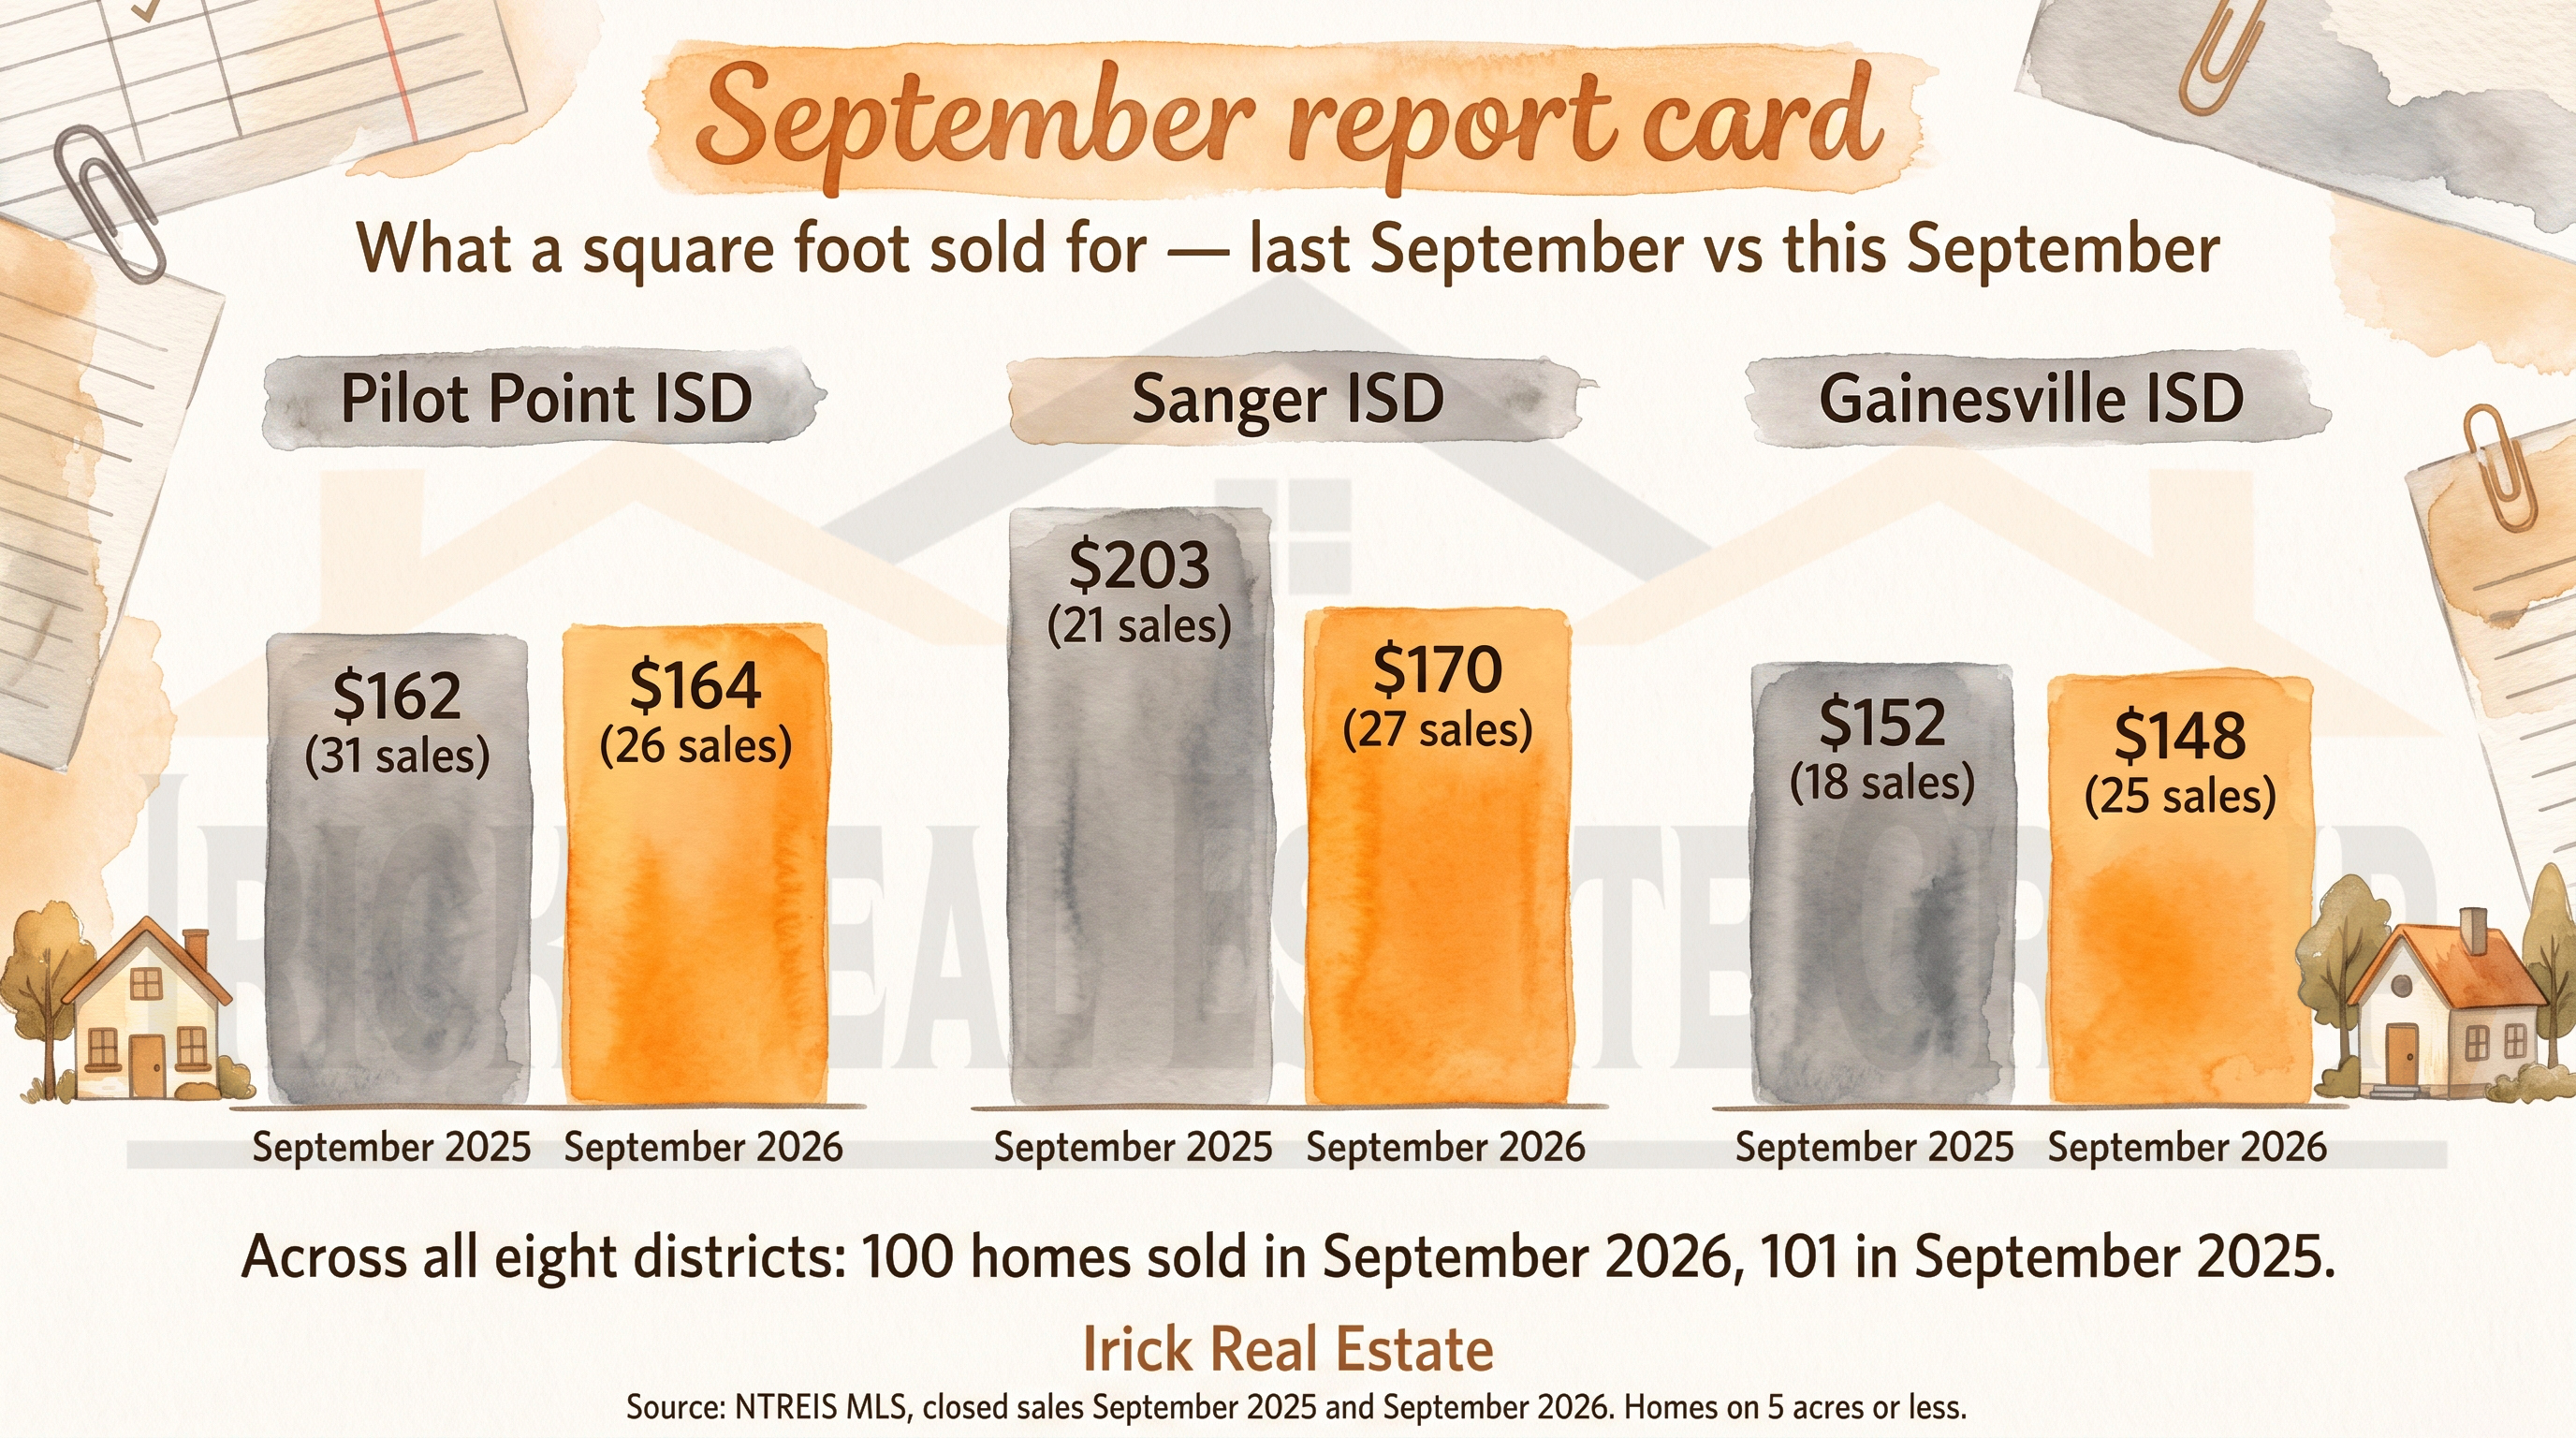
One hundred families bought a home in our eight districts this September. Last September, it was one hundred and one. So why does the market feel so different?
September’s books are closed, which makes this the week I hand you the report card. The headline number says nothing changed: buyers didn’t leave, demand didn’t collapse, and the market kept moving right through the 7% world we talked about last week. But the sale count only tells you how many families moved — not what they paid. That part depends entirely on which district you’re standing in.
Pilot Point held its ground — twenty-six sales at $164 a square foot against thirty-one at $162 last September. And that’s with eighteen of the twenty-six being brand-new homes at builder price points averaging $152; the resale homes that sold in Pilot Point last month brought $192 a square foot. Sanger is the district that tells you where the pressure is: twenty-seven sales, six more than last September, but at $170 a square foot instead of $203. Some of that is the builders — ten of those closings were new homes averaging $144 — but even Sanger’s resales came in at $185. More homes moved because sellers met the market, and the market asked for a real discount.
And Gainesville quietly turned in its busiest month of the entire past year: twenty-five closings, nearly triple August’s nine, at $148 a square foot — within a few dollars of last September. When homes are priced where the buyers actually live, they still line up.
I’ll be straight with you about the other five districts. Whitesboro, Callisburg, Tioga, Collinsville, and Valley View combined for twenty-two September sales, and at that size a single month can swing wildly — Valley View’s entire September was one closing. I don’t call that a trend in either direction, and I won’t pretend to. For the smaller districts, the year-to-date picture is the honest one.
So what do you do with this? If you’re selling, take the good news first: a hundred buyers showed up in September, same as last year. But they’re paying this fall’s prices, and in half our districts they can walk through a builder’s model home before they ever reach your driveway — which is why pricing against the market that exists, not the one from two springs ago, is what gets you moved. If you’re buying, the west side of our area has more negotiating room than it has had in years. And either way, your own district’s full September report — every month, five years back — is updated and waiting in the Current Market Data links at the bottom of this email. Find your district, see your numbers, and if you want to talk about what they mean for your address, that’s exactly the conversation I’m here for. I’m here to help.
Chance Kirby - Irick Real Estate
940.300.6900
Want to know what this means for your home? Call or text Chance Kirby at (940) 300-6900 for a free price opinion based on recent sales near you.