The Summer Report Card: What Sellers Kept of Their Asking Price


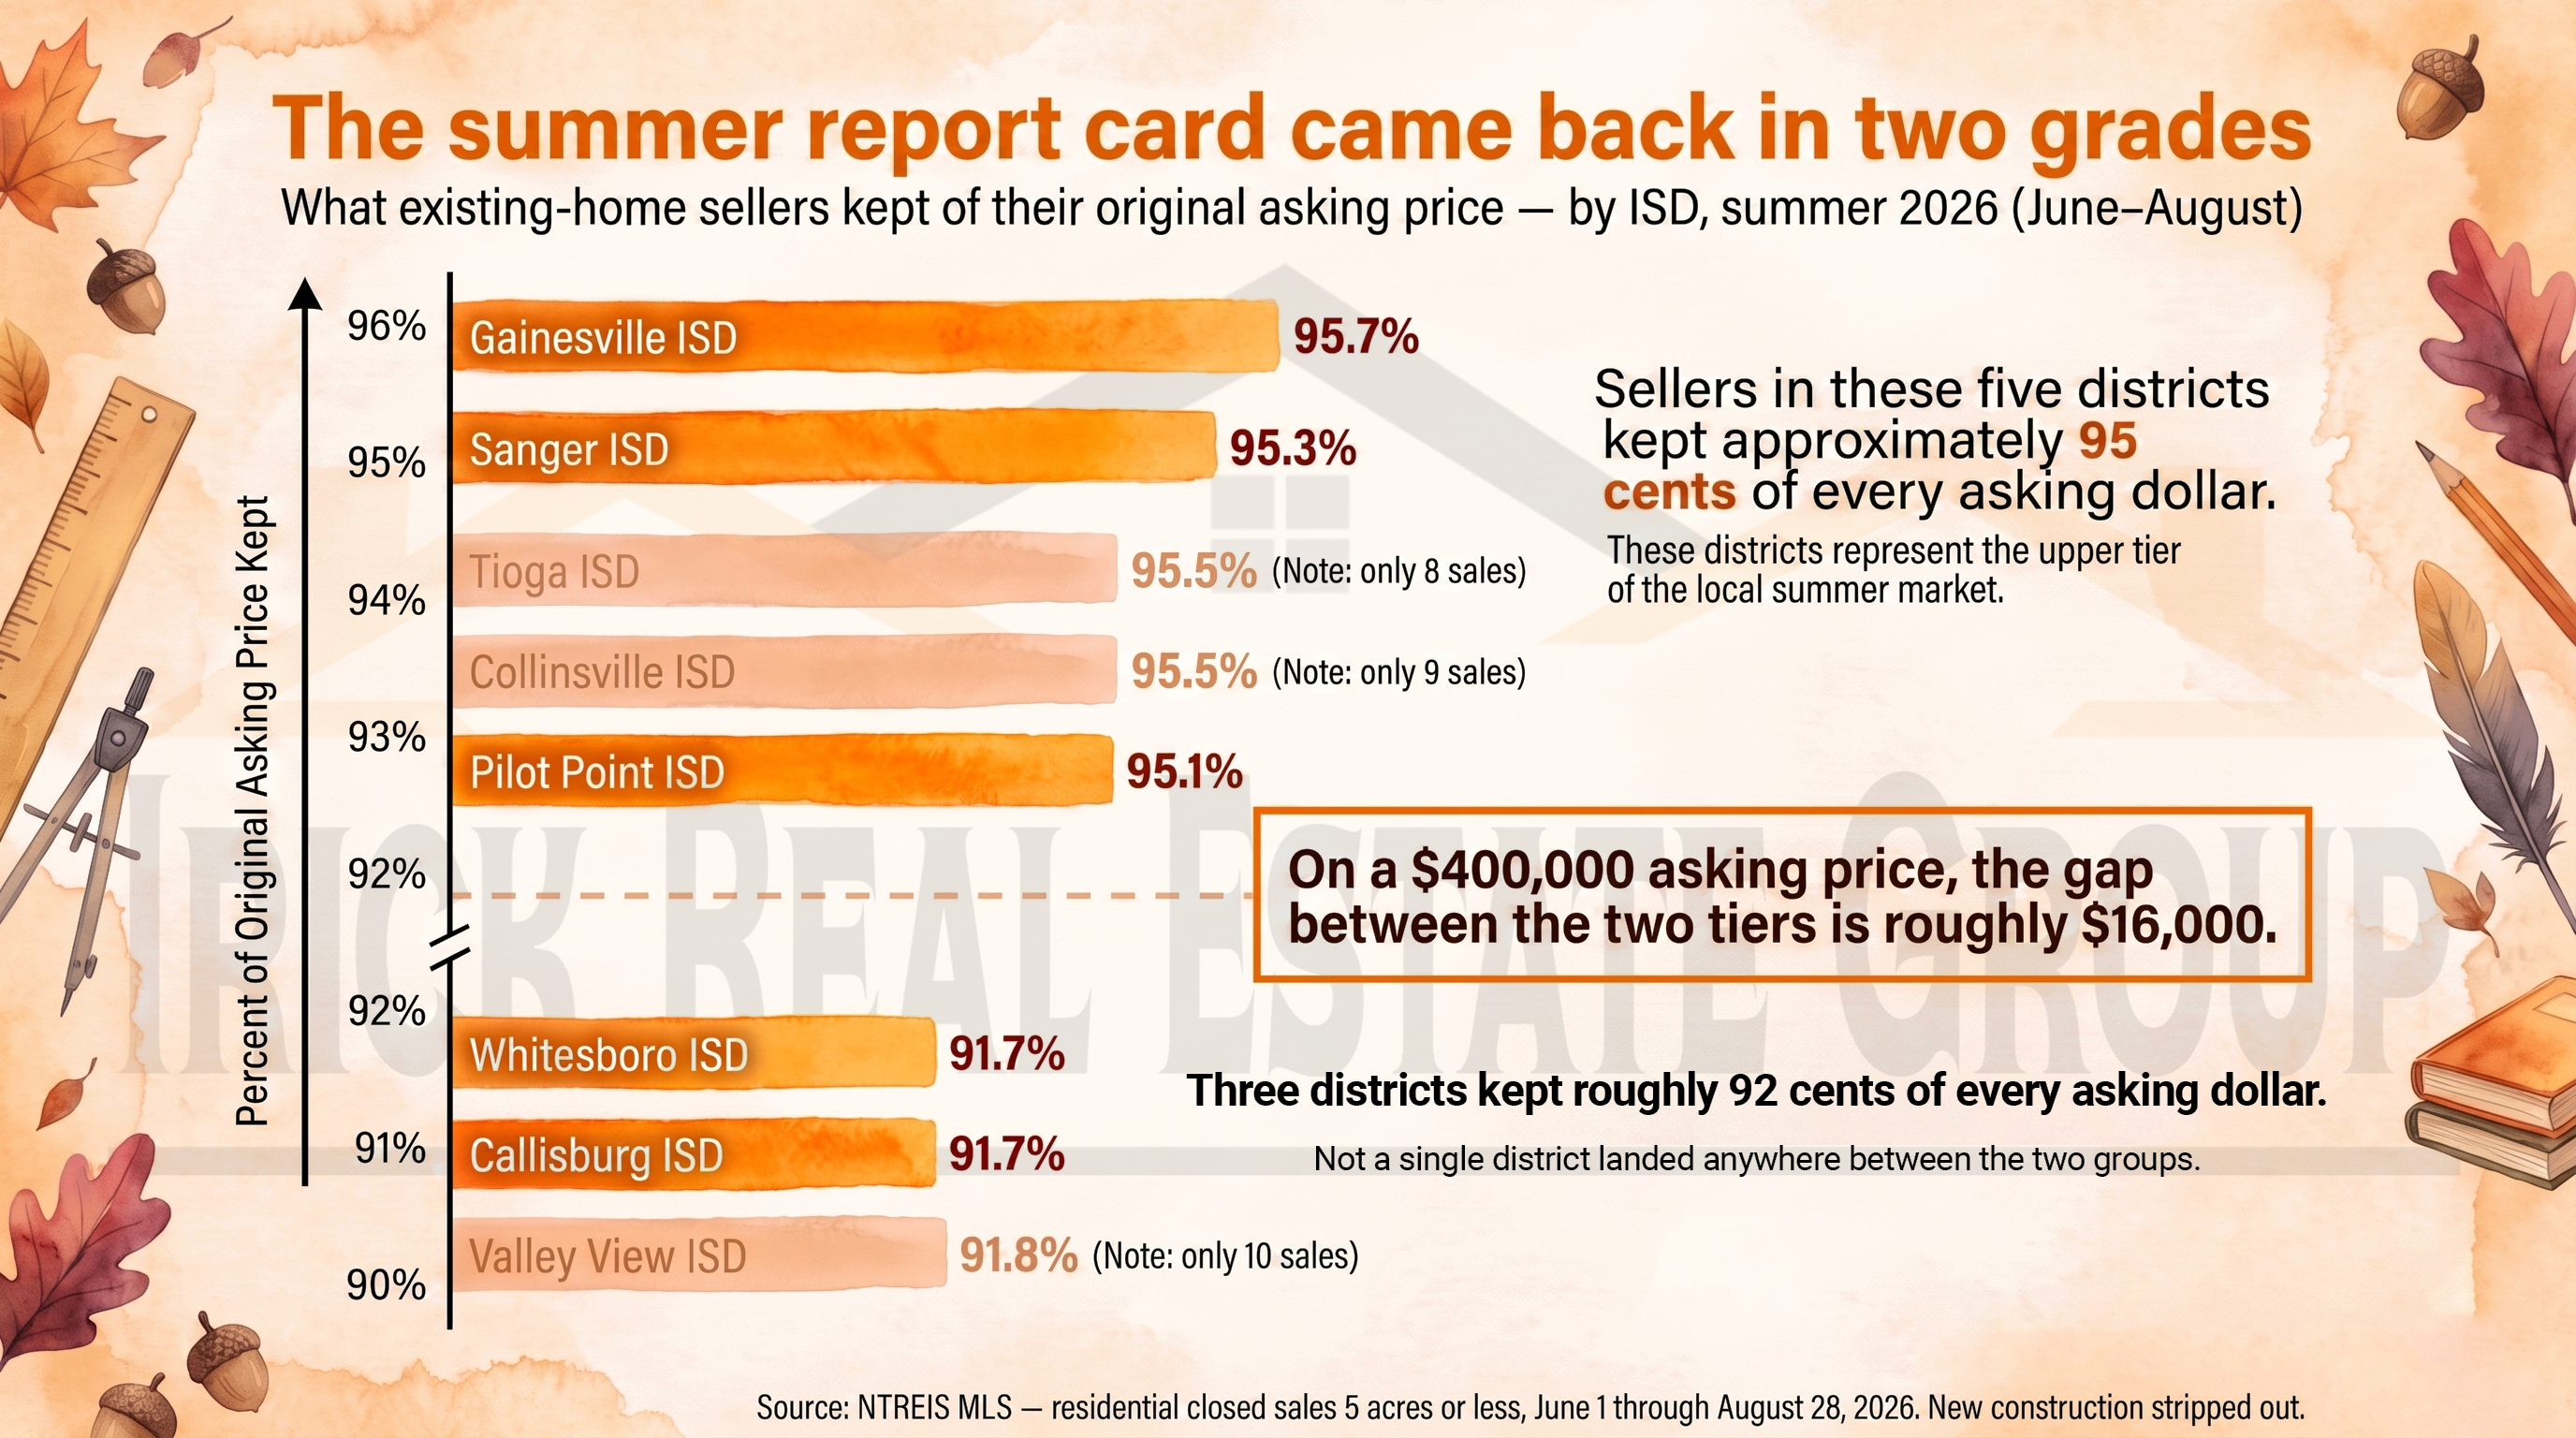
School's back, so it feels right that this week's chart is a report card. Summer just wrapped up — June through the end of August — and I graded each of our eight ISDs on one question: of the price a home first hit the market at, how much did the seller actually keep when the deal closed?
Before we read it, two words on how I counted, because they matter. First, this is existing homes only. Builders closed a lot of houses around here this summer — roughly four of every ten closings across our area were new construction, and in Pilot Point ISD it was about three of every four. A builder moving inventory with incentives and rate buydowns is playing a different game than a family selling the house they live in, so as always, the builders are stripped out. This chart is your market. And second, I'm measuring against the original asking price — the number the home first hit the market at, not the price after a cut or two. That's the honest yardstick, because it compares what sellers hoped for with what they actually got.
Now look at how the grades came back. There's no middle on this chart. Five districts landed together up around 95 cents on the dollar, three landed together down around 92 — and nobody in between. Gainesville ISD sellers held on best, keeping 95.7% of their original ask, with Sanger ISD and Pilot Point ISD right there with them. Down in the second tier, Whitesboro ISD and Callisburg ISD sellers kept about 91.7%. Same summer, same interest rates, same North Texas weather — two very different negotiating tables.
Let me put the gap in dollars. Take a home that listed at $400,000. In the top tier, that seller walked away with about $383,000 of the ask. In the second tier, about $367,000. That's roughly a $16,000 difference on identical asking prices, purely depending on which side of the map the house sits on. If you've been reading this newsletter for a while, you know I harp on this: there is no such thing as "the market" around here. There are eight of them.
One honesty note about the chart. Three districts — Tioga ISD, Collinsville ISD, and Valley View ISD — only had a handful of existing-home sales this summer, so their bars are printed faintly. A median of eight or ten sales is a hint, not a verdict. If you own a home in one of those districts and want to know what your summer really looked like, I'd rather pull your street than have you lean on a faint bar.
That's exactly why the right local knowledge matters right now. A DFW-wide average would have told you sellers kept about 94 cents on the dollar this summer — true, and useless, because almost nobody's district actually performed at the average. It can't tell you whether your home sits in 95-cent territory or 92-cent territory, or that Pilot Point ISD's headline numbers were three-quarters builder sales this summer. Thirty-four years of selling homes in our area is what lets me read which negotiating table your street actually sits at — and price your home for that table, not for a blended average of eight different markets. If you're thinking about selling this fall, or you just want a straight read on what your district's summer really looked like, I'm here to help.
Chance Kirby - Irick Real Estate
940.300.6900
Want to know what this means for your home? Call or text Chance Kirby at (940) 300-6900 for a free price opinion based on recent sales near you.